Jupyter Notebook 7.0; RATH / PyGWalker / GWalkR / Kanaries; vizGPT
Longtime readers may, indeed, wind up thinking the question posed in today’s tagline after reading this most unusual Wednesday edition.
I can promise y’all that I am not being held captive by a band of rogue Pythonistas or being threatened by OpenAI zealots.
A more fitting tagline for today is something along the lines of “Stuff hrbrmstr will never use, but that others might find interesting/useful.”
Jupyter Notebook 7.0
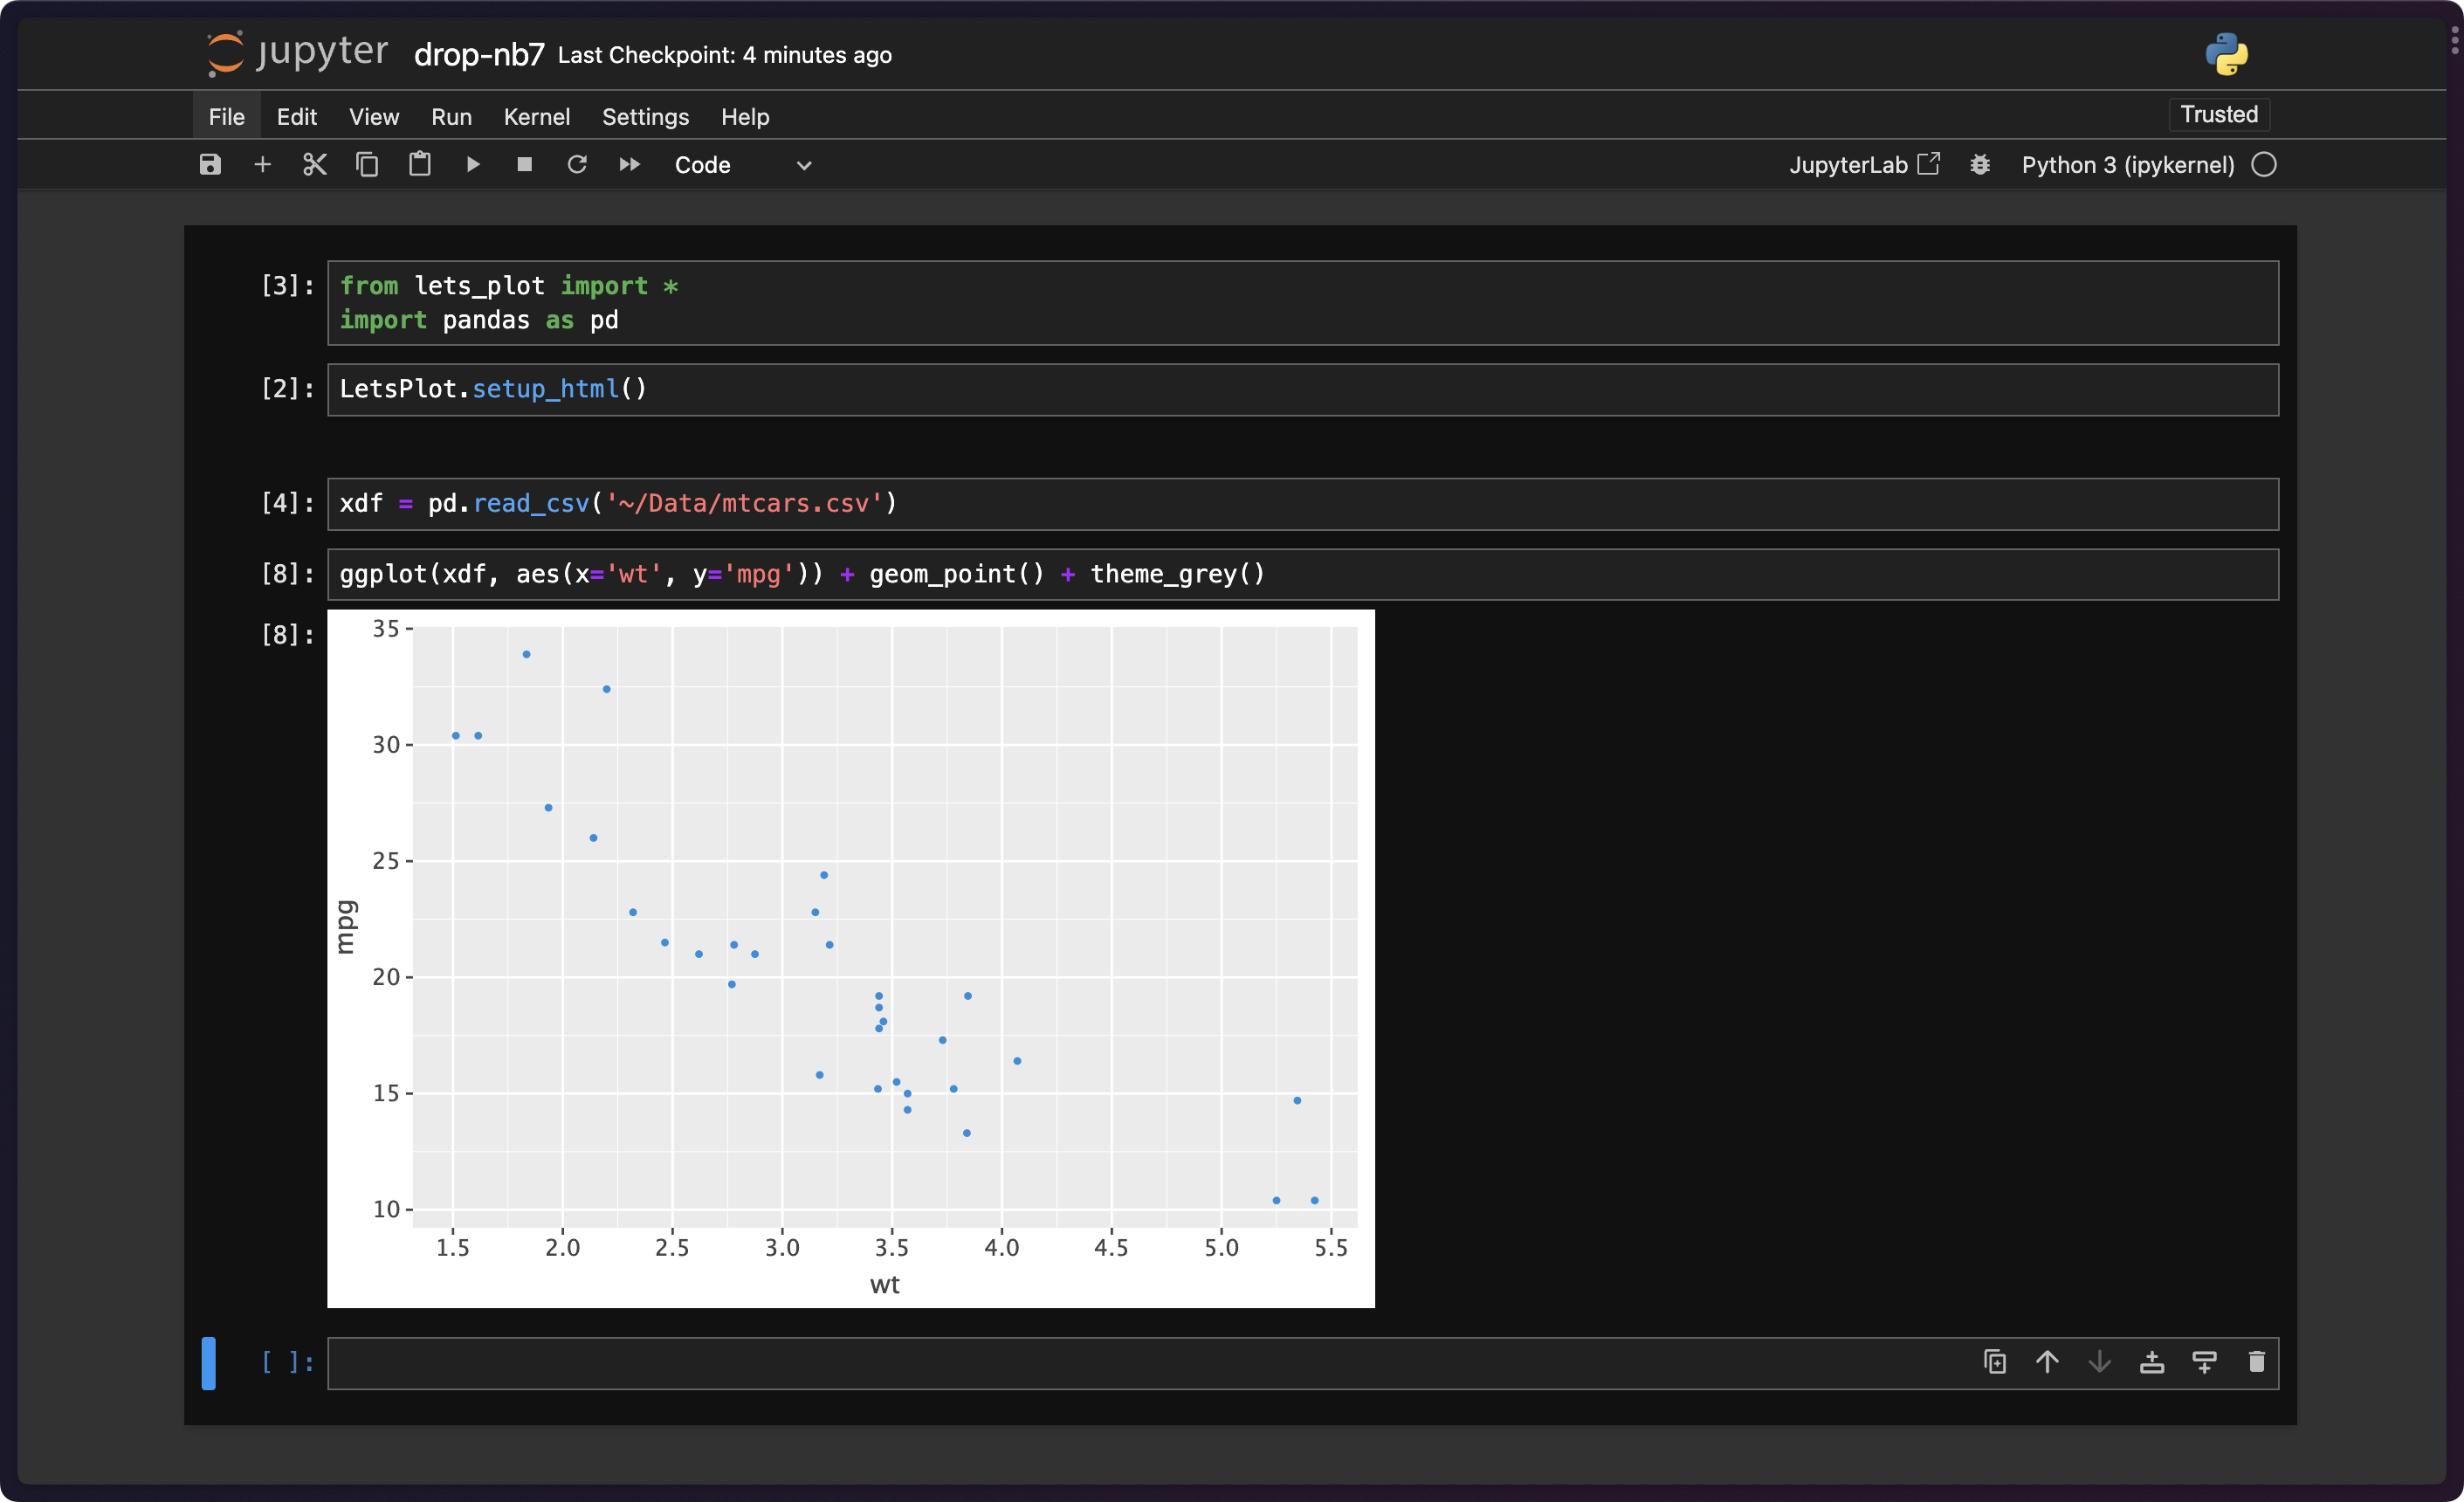
Some readers are likely shocked that I’m covering this topic, since I am a very vocal detractor when it comes to using Jupyter notebooks for, well, anything. But, a major new release came out last week, and — while I dislike them — I will not force my preferences on any of the team at work. So, I kind of have to know my enemy at least well enough to figure out if and how I need to rejigger my own workflows to ensure I can continue to collaborate with folks without disrupting productivity. Fundamentally that means, “Does quarto convert example.ipynb -o example.qmd still work?”, and — on the notebooks saved in 7.0, it appears to work just fine.
If you do live in this notebook ecosystem, chances are you caught this release, so I won’t belabor this section.
Fundamentally, Jupyter Notebook 7.0 introduces several new features and improvements compared to previous releases. Some major enhancements include:
debugger: Notebook 7 includes a new debugger that allows you to step through your code cell by cell, set breakpoints, and inspect variables.
real-time collaboration: This version enables real-time collaboration, allowing you to share your notebook with other humans and edit it simultaneously.
table of contents: A built-in table of contents feature is now available for easier navigation within notebooks.
theming and dark mode: Notebook 7 supports theming and dark mode, providing a more customizable and comfortable user experience.
internationalization: The new version offers improved support for multiple languages.
accessibility: Notebook 7 has improved compliance with Web Content Accessibility Guidelines (WCAG).
extension compatibility: Many popular JupyterLab extensions are now compatible with Notebook 7, providing a more seamless experience for folks transitioning between the two environments.
It’s important to note that Jupyter Notebook 7.0 is based on the JupyterLab codebase, which means that many JupyterLab features are also available in Notebook 7. However, this major upgrade may break some extensions or customizations from previous versions, so it’s recommended to read the migration guide to ensure a smooth transition.
For those that aren’t embedded in this ecosystem, JupyterLab provides an integrated development environment (IDE) with advanced features and a more complex environment, which can be overwhelming for beginners. On the other hand, Jupyter Notebook 7.0 maintains the familiar document-centric user experience while introducing new features and improvements. They each have their unique advantages and cater to different user preferences. JupyterLab is better suited for folks who require a more powerful and flexible IDE-like environment, while Jupyter Notebook 7.0 is ideal for those who prefer working with individual, self-contained notebooks.
I do applaud the Jupyter development team and contributors to the project. While I still find notebooks to be a terrible way to “do data science”, these upgrades — especially the internationalization and accessibility ones — are 👍🏽.
RATH / PyGWalker / GWalkR / Kanaries
While I’m in the spirit of covering tools I won’t ever use but that others with different tastes/preferences might find useful, we’ll take another moment to introduce a pair (more like a trio or gaggle rly) of data analysis and visualization tools. I’m even more inclined to cover RATH and PyGWalker since I’ll do almost anything to prevent folks from using Tableau.
RATH (GH) is an open-source, modern, automated data exploratory analysis and visualization platform developed by Kanaries Data. It purports to help streamline data analysis workflows and assist humans in discovering patterns, insights, and causal relationships in our datasets. RATH’s key features include:
automated data analysis with visualizations
augmented analytic engine for discovering patterns, insights, and causals
predictive transformation operations for data preparation
“one-click automated data analysis”
When discussing RATH, we also need to discuss PyGWalker, since it is a major component of RATH.
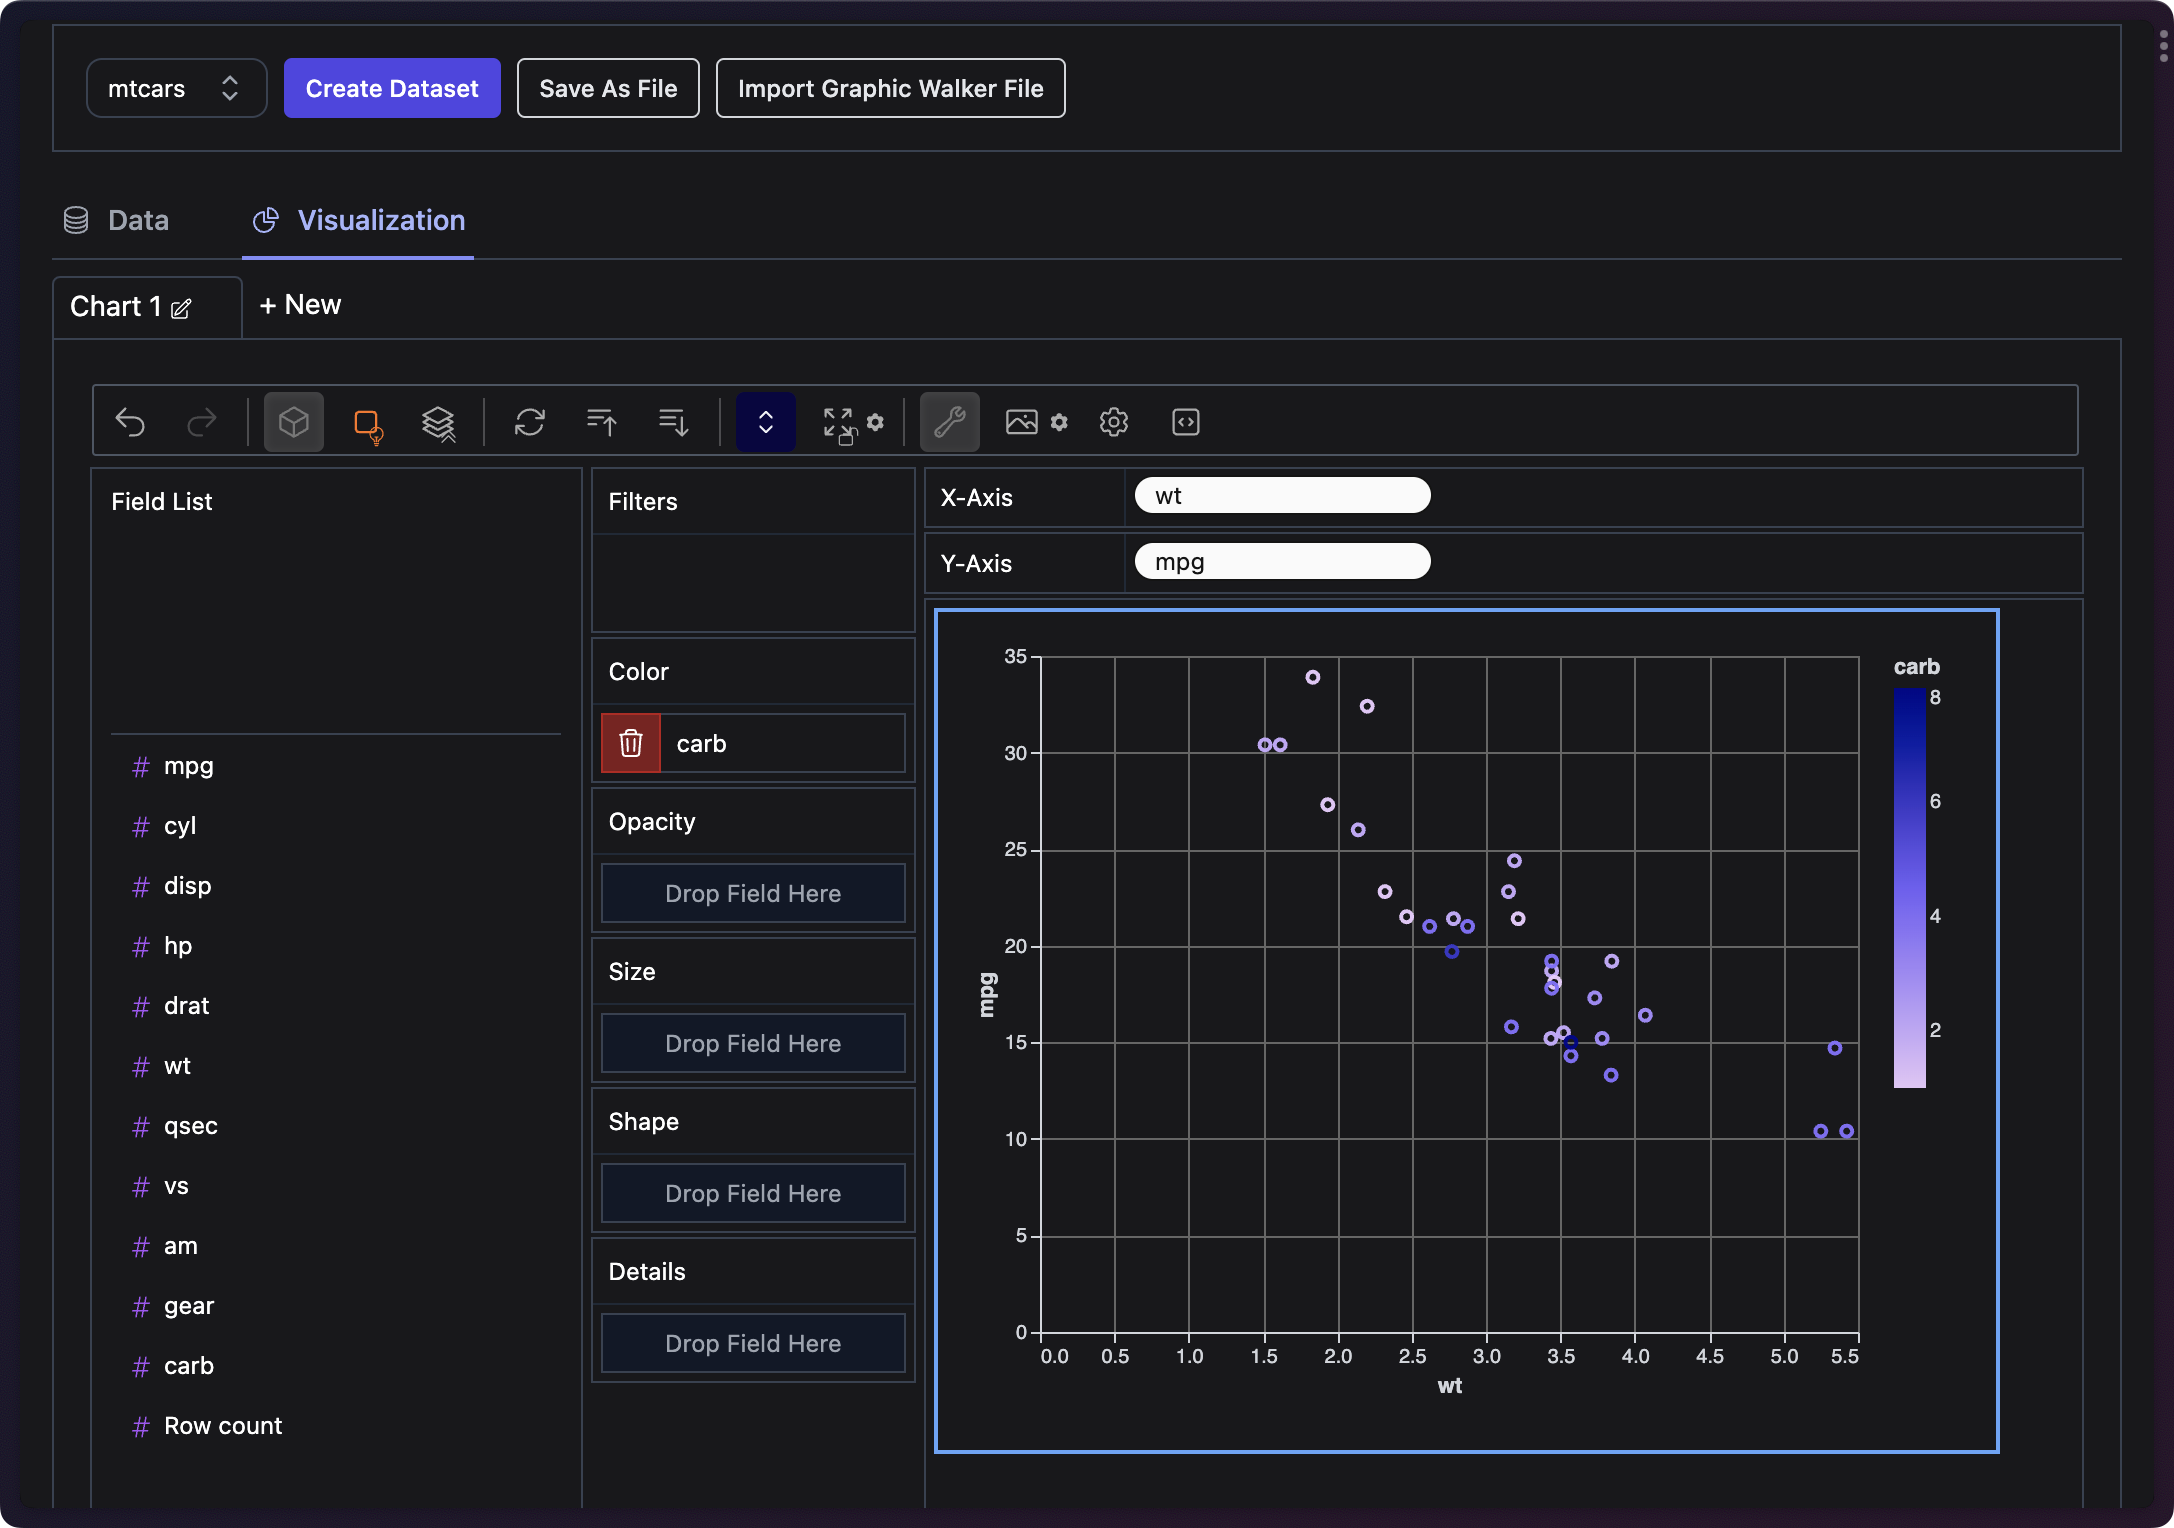
PyGWalker is a Python package that integrates Jupyter Notebook with Graphic Walker, an open-source alternative to (ugh) Tableau. It simplifies data analysis and visualization workflows by allowing users to turn pandas dataframes (i.e., any rectangular data source) into a Tableau-style user interface for visual exploration. PyGWalker provides an interactive experience and a visually appealing setup for data analysis and visualization within Jupyter notebooks. The section header image is a sample of the Graphic Walker environment (with my fav example dataset).
In RATH, you can use the visual interface of Graphic Walker to customize/enhance data visualizations, and one very nice attribute of Graphic Walker is the ability to export charts either in its native format or Vega-Lite format.
Kanaries has a (very modestly priced) freemium version of RATH which lets you work with larger(-ish) datasets and use “vizGPT”, which we’ll cover in the next section.
NOTE: Kanaries has a GWalkR R package that lets you do the same work as PyGWalker but in R/RStudio (etc.). R folks are four function calls:
remotes::install_url("https://kanaries-app.s3.ap-northeast-1.amazonaws.com/oss/gwalkr/GWalkR_latest.tar.gz")
library(GWalkR)
data(iris)
gwalkr(iris)
away from giving it a go. It will have “data copilot” features and Shiny integration “soon”, so it’s something for folks to keep an eye on.
In fact, besides the above, Kanaries has a plethora of other, interesting tools to play with (which we may cover at some point but likely not, hence the link drop).
vizGPT

The goal of vizGPT (GH) is to help us make contextual data visualizations from tabular datasets with a chat interface. Its working principle is pretty straightforward. We can describe the chart we want to create in prose, and vizGPT’s natural language interface will analyze the input and generate the chart type, layout, data, and styles according to the description. This enables folks to explore data without the complexity of typing complicated queries or dealing with traditional drag-and-drop visualization tools.
For example, if we wish to create a scatter plot showing the relationship between two variables — say, “wt” and “mpg”1 — we can simply type “Compare weight to miles per gallon” and vizGPT will generate the visualization accordingly (it figures out bits like quantitative vs. factor value types).
Context is preserved between prompts, so it is possible to “tweak” the resulting visualization, and we’ll soon be able to save the “notebook” and export the data visualizations in Graphic Walker or Vega-Lite formats.
While I have no present personal use for vizGPT, it could end up being a great way to onboard new folks into “data science” or at least basic data analysis. Note that this tool does suffer from the “please enter your (Azure) OpenAI API key” dependency (if you intend to run it yourself).
FIN
Thankfully, we go back to covering things I might actually use, tomorrow. ☮
I cannot imagine why I’d randomly pick those two.

Leave a comment