Observable Highlights
On The Seventh Day Of Quick Drops 🎅🏽hrbrmstr🎅🏽 Gave To Me…
🎶 Cool Notebooks Observing! 🎶
(If this is your first Xmas Quick Drop, head back to Day 01 to find out what’s going on.)
hrbrsanta’s sleigh is in transit mode today (the nor’easter delayed our Xmas migration to the grandson’s abode) so this is truly a proper quick drop. Said drop features some cool Observable notebooks, with an ulterior motive being to further give you reason to try out Observable (it’s free!) and make some awesome things of your own.
Getting Started: Yes, even the tutorials are cool, and this is a great place to start exploring Observable, especially since it has sections geared towards helping users familiar with other technologies (Excel, Python, …) to transfer said skills over to Observable javascript. (They really need to move some nascent Observable for R users content — wrangling & plotting — into that section.)

Observable Ambassadors: The Observable community is active, engaged, and super-helpful. They’re called Ambassadors, and checking out their creations is akin to feasting upon an elegant tasting menu at some fancy restaurant (except, recipes are also included).

Stealing Other People’s Work: I don’t know why, but somehow my brain had a major impasse when Observable first launched. Perhaps it was hubris; or, it may have just been my inability to grok this at first. But, Observable has this idiom called “Import“, which is akin to Python’s
import, R’slibrary(), Rust’suse, etc. Regardless, I’ve managed to finally get comfortable treating the entire Observable public ecosystem as a giant package repository, which absolutely speeds up the time-to-productivity.
Sparklines: A few years back, in what might be dubbed the Bronze Age of 21st Century data visualization, sparklines were all the rage. The linked, recent notebook shows how to use the Sparks typeface in many Observable contexts.

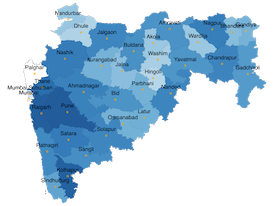
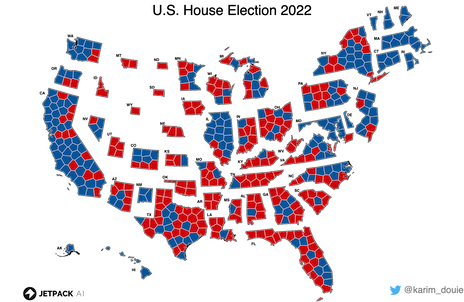
Cartogram Deep-Dive: A new way to look at the U.S. that shows all the work.
*Time Spirals: These, too, were all the rage; and, folks seem to still find them compelling, today.

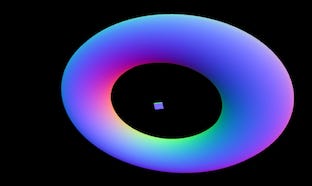
The Third Dimension: Observable is a great place to explore the world of GPU-centric, 3D visualization. Whether it be ray tracing, learning WebGL, or kicking the Three.js tyres.


FIN
Looks like Homestar Runner also decided to get into the holiday spirit this year, as well. ☮

Leave a comment